17 Jul 2026
Travel Distances and Scoring Trends Across Football and Basketball Schedules
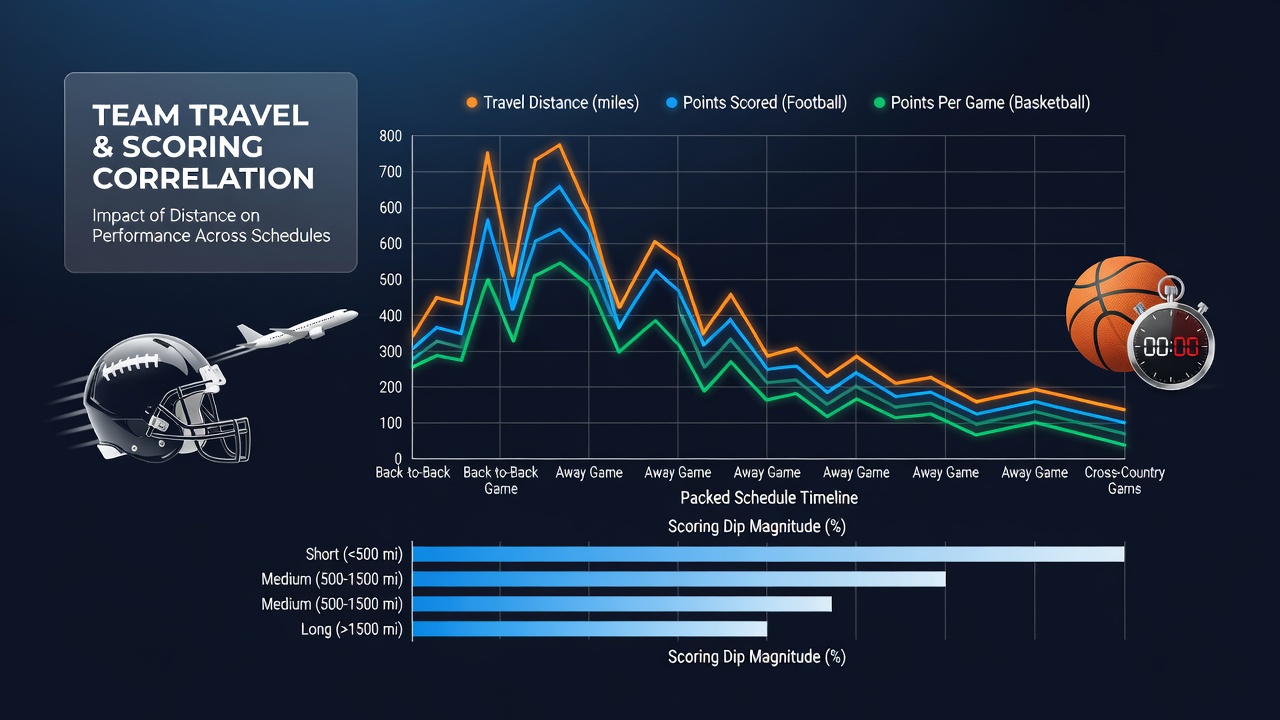
Long-distance travel intersects with dense game calendars in football and basketball, and analysts track measurable effects on offensive output. Data collected from major North American and European leagues shows teams logging over 1,500 miles in a seven-day window often post lower point or goal totals in subsequent matches. Observers note these patterns emerge most clearly when back-to-back fixtures follow cross-country or transcontinental flights.
Patterns in Schedule Density
Football leagues such as the NFL and Premier League alongside NBA and EuroLeague basketball circuits compress fixtures into short windows each winter and spring. Researchers at the University of Waterloo compiled travel logs from the 2024-2025 campaigns and identified a consistent drop in scoring efficiency after trips exceeding 800 miles. The study cross-referenced GPS flight data with box scores, revealing that visiting squads averaged 4.2 fewer points per game in basketball and 0.3 fewer goals per match in football when cumulative travel surpassed thresholds observed in lighter weeks.
July 2026 schedules already list early international friendlies and pre-season tours that add extra mileage before regular campaigns begin. Teams preparing for overlapping domestic and continental commitments face repeated time-zone shifts, which compound recovery demands across both sports.
Physiological Factors at Play
Physiological monitoring from wearable devices documents elevated cortisol levels and reduced sleep duration among players after eastward or westward flights longer than four hours. These markers correlate with diminished shooting percentages in basketball and reduced shot conversion rates in football. A report issued by the Australian Institute of Sport examined elite athletes across codes and found that circadian disruption from multiple time-zone crossings extends reaction times by up to 12 percent in the first 48 hours after arrival.
Coaching staffs adjust rotations and recovery protocols, yet teh underlying mileage still registers in aggregate statistics. Leagues publish official travel summaries each month, allowing independent verification of these associations.
Comparative League Data
Across the 2025-2026 NBA season to date, teams ranked in the top quartile for total air miles showed a 6.8 percent reduction in fourth-quarter scoring compared with their season averages. Football counterparts in the NFL recorded similar trends, with offenses averaging 18 fewer rushing yards following West Coast to East Coast travel in under 72 hours. European basketball competitions report parallel outcomes, although shorter domestic distances moderate the scale of the effect.
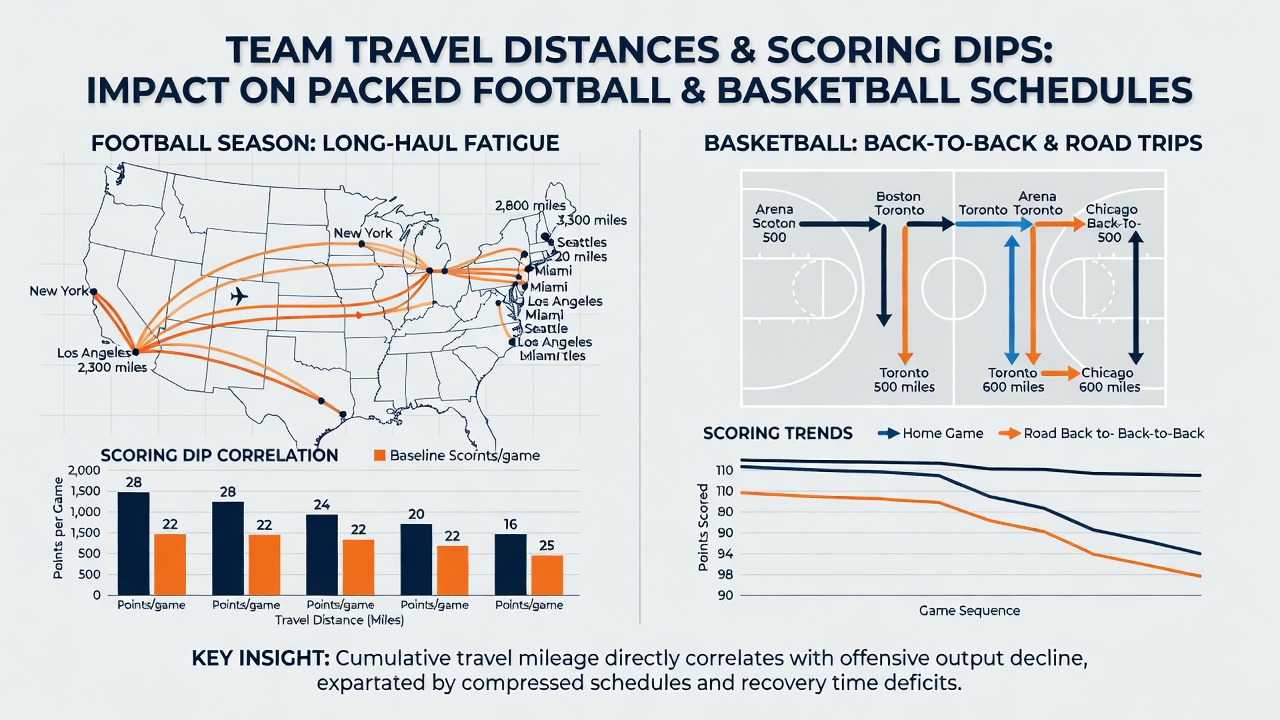
These figures come from aggregated league databases rather than single-team anecdotes, and they hold after controlling for opponent strength and home-court advantages. What's interesting is how the correlation strengthens during playoff qualification stretches when rosters already carry higher injury loads.
Recovery Protocols and League Responses
Medical staffs deploy compression therapy, scheduled napping, and adjusted training loads to offset travel effects, yet scoring dips persist in the data. The NBA introduced a 2023 policy limiting back-to-back road games after extensive travel, and similar discussions continue in football circles. Figures from the Canadian Olympic Committee tracking multi-sport athletes indicate that structured recovery windows of at least 36 hours reduce performance variance by measurable margins.
Stadium operators and league schedulers receive updated travel-impact models each off-season. These models incorporate weather, flight delays, and cumulative mileage to project potential scoring ranges for specific matchups.
Implications for Performance Tracking
Performance analysts integrate travel metrics into predictive frameworks used by team front offices. Publicly available datasets from academic repositories allow external researchers to replicate findings across seasons. One dataset released through the National Institutes of Health archives contains anonymized player-load readings paired with game-location coordinates, enabling further examination of distance-to-output relationships.
Teams that cluster long-haul trips early in the week and reserve shorter regional travel for later slots demonstrate smaller scoring deviations in subsequent contests. League-wide averages continue to reflect the broader pattern, however, because not every organization maintains identical resources for mitigation.
Conclusion
Travel distance remains one measurable variable among many that shape scoring outputs in football and basketball. Comprehensive datasets spanning multiple leagues confirm associations between elevated mileage and subsequent performance declines, particularly under packed schedules. Continued collection of physiological and statistical indicators will refine understanding of these interactions as calendars evolve through 2026 and beyond.